Current Views: 122315
 Current Downloads: 74724
Environment and Resource
ISSN Print:2707-2398
ISSN Online:2707-2401
Contact Editorial Office



Subscribe to the latest published information from SCISCAN
Polished Version - Reservoir Characteristics of Fine-Grained Rocks in the Du-3 Submember of the Fourth Member of the Shahejie Formation, Western Sag of the Liaohe Depression


-
Information:
1. Liaohe Oilfield, CNPC, Panjin, Liaoning;
2. College of Petroleum Engineering, Liaoning Petrochemical University, Fushun, Liaoning;
3. Research Institute of Exploration and Development, Qinghai Oilfield, CNPC, Dunhuang, Gansu
-
Keywords:
Western sag; Fine-grained sedimentary rocks; Unsupervised learning; Overlapping probability; Reservoir evaluation
- Abstract: Lacustrine fine-grained sedimentary rocks comprising mixed clay minerals, felsic minerals, carbonates, and analcime were deposited in the Du-3 Submember of Member 4 of the Shahejie Formation in the Leijia area, Western Sag, Liaohe Depression. These rocks have become key targets for tight-oil and shaleoil exploration in recent years. Building upon previous studies, this work integrates drilling, wireline logging, mud logging, and laboratory analytical data, and incorporates an unsupervised learning approach to: (1) classify fine-grained rocks in the target interval, (2) characterize fundamental reservoir geological attributes, (3) evaluate reservoir quality, and (4) predict favorable zones. K-means clustering was performed on 303 sets of quantitative whole-rock X-ray diffraction (XRD) data, classifying the Du-3 lithologies into three types: carbonate rocks, felsic mixed fine-grained rocks, and analcime-rich mixed fine-grained rocks. Among these, carbonate rocks and analcime-rich mixed fine-grained rocks exhibit higher brittleness and are thus to fracturing. Dissolution pores and vugs preferentially develop along fractures, resulting in improved storage and seepage capacity. Overall, the Du-3 reservoirs are characterized by small pore–throat radii, poor sorting, low homogeneity coefficients, and an unfavorable pore structure. The development of effective reservoirs relies primarily on micropores and microfractures. Using an overlapping probability evaluation method, six key factors controlling reservoir development—brittleness index, carbonate thickness, fracture density, average porosity, average permeability, and total organic carbon (TOC)—were integrated for reservoir assessment. Favorable reservoir zones are mainly distributed along the long axis of the lacustrine basin, including the L15–L84–L59–S90–L93 well areas.
- DOI: 10.35534/er.0802039
- Cite: Li, Y., Chen, C., Zhou, X. L., Huang, Y. L. (2026). Polished Version - Reservoir Characteristics of Fine-Grained Rocks in the Du-3 Submember of the Fourth Member of the Shahejie Formation, Western Sag of the Liaohe Depression. Environment and Resource, 8(2), 286-298.
In recent years, mixed fine-grained sediments with grain sizes <62.5 μm, dominated by felsic minerals, clay minerals, and carbonates, have been increasingly recognized in continental lacustrine basins(Cao et al. 2023; Guo, Zhao, and Chen 2021). Many researchers collectively refer to these deposits as lacustrine mixed fine-grained sedimentary rocks. Such rocks are characterized by diverse colors, well-developed lamination, abundant sedimentary structures, rapid vertical variability, and strong heterogeneity, resulting in complex and highly variable lithofacies distributions. They are widely distributed in multiple basins and stratigraphic successions in China, including the Paleogene of the Bohai Bay Basin, the Permian of the Junggar Basin, the Jurassic of the Sichuan Basin, the Paleogene of the Qaidam Basin, the Triassic of the Ordos Basin, and the Cretaceous of the Songliao Basin(Jiang et al. 2022; Jiang et al. 2021; Du et al. 2020; Du 1992). Mixed fine-grained sedimentary rocks preserve relatively complete and detailed records of lake-basin evolution, provenance supply, regional tectonism, and climate change, and they also serve as important hosts for shale oil and tight oil/gas resources.
The Du-3 Submember of Member 4 of the Shahejie Formation in the Leijia area, Western Sag, exhibits typical fine-grained depositional characteristics. Previous studies have intensively investigated its depositional environment, the genesis of dolostones, and the origin of analcime, yielding substantial progress. For example, Zhao Huimin suggested that the Paleogene Member 4 of the Shahejie Formation in the Leijia area is characterized by mixed deposits dominated by lacustrine carbonates and terrigenous clastic rocks, with diverse lithologies and complex textures and structures. Song Bairong et al. proposed that the rocks of the Dujiazi oil-bearing interval are mainly argillaceous, analcime-bearing micritic dolostones, and that the formation of analcime dolostones is closely related to mineral alteration of the Fangshenpao Formation basalts and hydrothermal activity at the lake bottom. Huang Lei and Li Tian et al. reported two genetic types of lacustrine dolostones in the Leijia area, namely penecontemporaneous dolomitization and hydrothermal-sedimentary dolomitization(Li et al. 2022; Li 2016). In addition, Huang Lei, Chen Zhijun, Fang Rui, and co-workers documented three main occurrences of analcime—laminated, fracture-filling, and nodular—attributing its formation primarily to volcanic–hydrothermal fluids and sedimentary differentiation processes(Fang et al. 2020).
Although numerous studies have also addressed reservoirs in the Gaosheng–Shuguang area of the Western Sag, existing work has not yet established an effective classification scheme for the fine-grained rocks in the Du-3 Submember of the Leijia area, nor has it developed robust reservoir evaluation criteria. Therefore, building upon previous studies, this paper systematically characterizes the reservoir geological attributes of the Du-3 Submember and, using an overlapping probability evaluation method, assesses the development of high-quality reservoirs and predicts favorable reservoir zones.
1 Geological Settings
Carbonate hydrocarbon reservoirs in the Leijia area were discovered in Member 4 of the Shahejie Formation as early as the 1990s. With decades of exploration and development, exploration targets have progressively shifted from conventional reservoirs to tight-oil reservoirs and, more recently, to shale-oil reservoirs.
The Liaohe Depression is located in the northeastern part of the Bohai Bay Basin. It is a multi-cycle Cenozoic continental rift basin formed on the North China Platform under regional extensional tectonism during the Mesozoic–Cenozoic. Structurally, it exhibits a “three uplifts–three sags” configuration. The Western Sag is the largest secondary negative structural unit within the Liaohe Depression and trends NE–SW. It is a narrow, half-graben–type fault depression characterized by a steep eastern faulted margin and a gentle western flexural margin (i.e., east-faulted and west-overlapped; steep in the east and gentle in the west). The Leijia area is situated in the north-central part of the Western Sag and includes two secondary sub-sags, the Chenjia and Taian sub-sags.
During deposition of the Du-3 Submember, the basin was dominated by semi-deep to deep lacustrine subfacies, whereas delta and fan-delta facies were common along the basin margins. The rocks show complex compositions and are mostly mixed deposits of clay minerals, felsic minerals, carbonates, and analcime. Sedimentary structures such as lamination and convolute deformation are common. The rocks are relatively brittle, and reservoir fractures and dissolution pores are well developed, commonly accompanied by favorable hydrocarbon shows.
2 Classification of Fine-grained Sedimentary Rocks
The nomenclature and classification of fine-grained sedimentary rocks have long been a central topic in sedimentology. Since Picard first introduced the ternary end-member approach in 1971, ternary-diagram–based methods have been widely adopted for classifying fine-grained rocks, and a variety of derivative schemes have been proposed. In continental lacustrine systems, fan-shaped or ternary-based classification frameworks are also commonly used to describe mixed fine-grained deposits characterized by rapid lateral/vertical facies changes and strong heterogeneity.
In the Leijia area of the Western Sag, the Du-3 Submember (Member 4 of the Shahejie Formation) is mineralogically dominated by four groups: clay minerals, felsic minerals, carbonates, and analcime, with minor iron minerals (hematite + limonite). Quantitative whole-rock X-ray diffraction (XRD) data (303 datasets from cores and sidewall cores across 16 wells) show mean contents of 15.5% (clay), 29.0% (felsic), 37.3% (carbonates), and 23.3% (analcime) (Figure 1a; Table 1). Importantly, the compositional ranges of felsic minerals, carbonates, and analcime partially overlap, and their abundances are broadly comparable, indicating a pronounced mixed-mineral character rather than a single-component dominated assemblage.
To establish an effective and operable lithological classification for the Du-3 fine-grained rocks, this study adopts a ternary end-member scheme in which the intrabasinal chemical component is represented primarily by carbonates + analcime(Cao et al. 2023). Using this framework, the rock assemblages can be broadly grouped into siltstone, claystone, chemical rocks, and mixed fine-grained sedimentary rocks (Figure 1b). Petrographic and core observations further reveal diagnostic textures that support the subdivision of these categories, including: (i) dolostone/limestone intervals with locally developed dissolution pores and vugs; (ii) analcime-bearing micritic dolostone and analcime-rich mixed fine-grained rocks with well-developed laminations and frequent fractures, where fractures are commonly (partly) filled by analcime; and (iii) felsic mixed fine-grained rocks characterized by distinct felsic laminae alternating with micritic or argillaceous laminae (Figure 2)(Chen et al. 2021; Peng et al. 2022). These features provide the geological basis for linking mineralogical classifications to reservoir-relevant fabrics and heterogeneity in the Du-3
Submember.
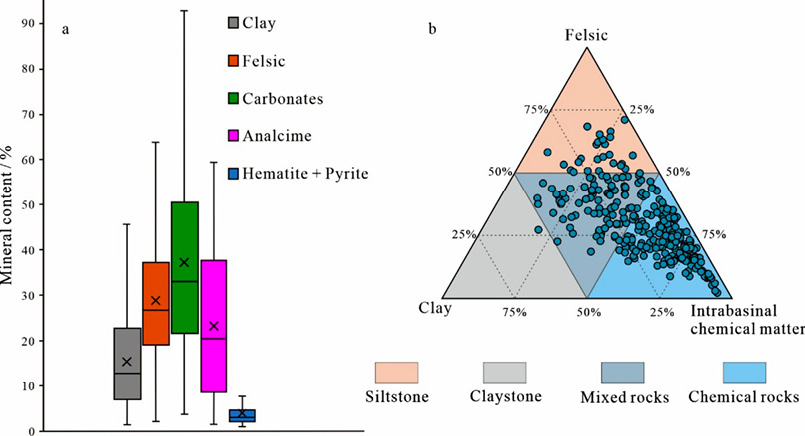
Figure 1 Mineralogical composition of the Du-3 Submember and ternary-based lithological classification
Note: (a) Boxplots of quantitative whole-rock XRD results showing the contents of clay minerals, felsic minerals, carbonates, analcime, and iron minerals (hematite + limonite). (b) Ternary diagram used for classifying fine-grained rocks in the study area, with end-members of clay, felsic minerals, and intrabasinal chemical matter (carbonates + analcime); fields indicate siltstone, claystone, mixed rocks, and chemical rocks.
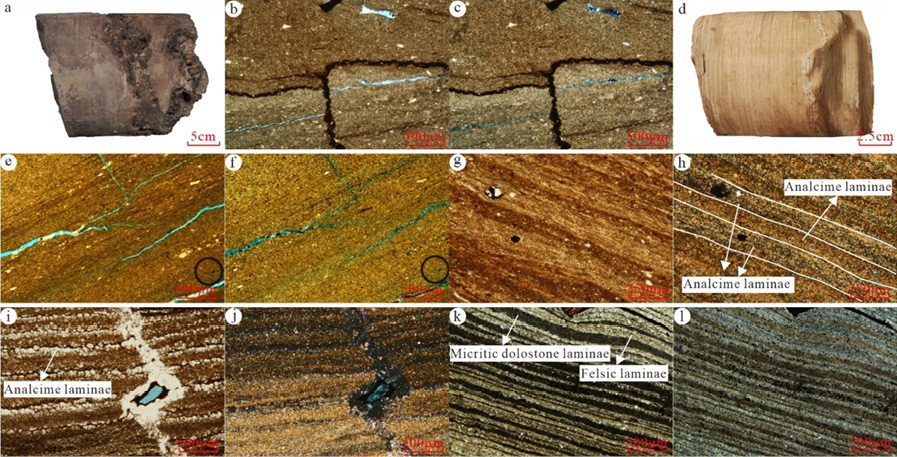
Figure 2 Representative core photographs and thin-section photomicrographs illustrating macroscopic and microscopic characteristics of the Du-3 fine-grained rocks
Note: (a) Argillaceous dolostone with well-developed dissolution pores/vugs, L84, 2649.5 m. (b–c) Analcime-bearing argillaceous micritic dolostone with multiple generations of fractures and gypsum-mold pores; L84, 2649.5 m; (b) plane-polarized light (PPL), (c) cross-polarized light (XPL). (d) Light gray–yellow argillaceous dolostone, L18, 2444.4 m. (e–f) Argillaceous micritic dolostone in which fractures are filled by analcime, L18, 2444.4 m; (e) PPL, (f) XPL. (g–h) Laminated analcime-rich mixed fine-grained rock (analcime laminae highlighted), L29-15, 2613.35 m; (g) PPL, (h) XPL. (i–j) Laminated analcime-bearing micritic dolostone with fractures partly filled by analcime, L36, 2562.10 m; (i) PPL, (j) XPL. (k–l) Laminated felsic mixed fine-grained rock showing alternating felsic and micritic/dolomitic laminae, L99, 3352 m; (k) PPL, (l) XPL. Scale bars are shown in each panel
表
|
Statistical Parameter |
Clay Minerals (%) |
Felsic Minerals (%) |
Carbonates (%) |
Analcime (%) |
Iron Minerals (%) |
|
Maximum |
47.3 |
68.4 |
92.7 |
59.4 |
15.0 |
|
Minimum |
1.4 |
2.2 |
3.7 |
1.5 |
1.0 |
|
Mean |
15.5 |
29.0 |
37.3 |
23.3 |
4.0 |
|
Number of Samples |
301 |
303 |
303 |
216 |
97 |
3 Basic Reservoir Characteristics of Fine-grained Rocks
3.1 Types and Characteristics of Reservoir Space
Carbonate rocks, felsic mixed fine-grained rocks, and analcime-rich mixed fine-grained rocks all have the potential to act as reservoir lithologies in the Du-3 Submember(Huang 2016; Li et al. 2022). Observations from thin sections, SEM images, and core samples indicate that reservoir space is primarily composed of dissolution-related pores (including vugs/cavities and moldic pores) and fractures, with pore connectivity and effective storage largely controlled by fracture development (Figure 3).
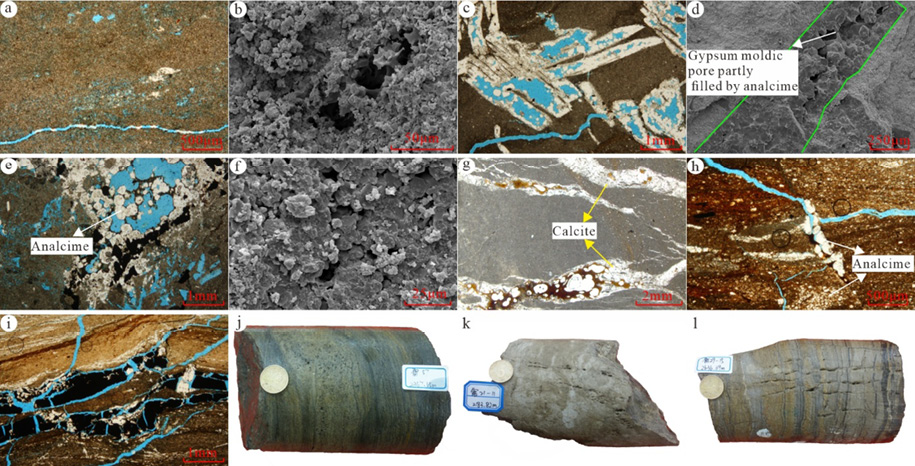
Figure 3 Reservoir-space types and representative characteristics of fine-grained rocks in the Du-3 Submember, Blue epoxy highlights pore space in thin sections.
Note: (a) Argillaceous micritic dolostone with well-developed dissolution pores and fractures, L36, 2513.04 m (thin section, PPL). (b) SEM image showing dissolution pores in argillaceous micritic dolostone, L36, 2513.04 m. (c) Argillaceous analcime-bearing micritic dolostone; gypsum moldic pores partly filled by analcime, L36, 2562.6 m (thin section, PPL). (d) SEM image of gypsum moldic pores partly filled by analcime, L36, 2562.6 m. (e) Analcime-bearing argillaceous micritic dolostone with local brecciation; dissolution cavities infilled by analcime, with gypsum molds present, L84, 2649.5 m (thin section, PPL). (f) SEM image showing dissolution pores, L84, 2649.5 m. (g) Argillaceous micritic dolostone; fractures partly cemented by calcite with oil staining/residual oil, L93, 2875.3 m. (h) Analcime-rich mixed fine-grained rock with multi-stage fractures filled by analcime, L57, 2633.45 m (thin section, PPL). (i) Analcime-rich mixed fine-grained rock; multi-stage fractures filled by analcime and organic matter, L57, 2355.52 m (thin section, PPL). (j) Laminated analcime-rich mixed fine-grained rock with well-developed dissolution pores, L57, 2367.65 m (core). (k) Gray argillaceous micritic dolostone with abundant fractures, L21-11, 2183.82 m (core). (l) Brownish-gray laminated argillaceous micritic dolostone interbedded with gray–black laminated dolomitic mudstone, showing pervasive fracturing, L29-15, 2636.69 m (core). Scale bars are shown in each panel.
In carbonate-dominated intervals, dissolution of unstable components produces abundant secondary porosity(Liu et al. 2020). Two pore types are particularly common. (1) Irregular dissolution pores/vugs, which vary widely in size and geometry and typically occur in clusters; these pores are locally associated with microfractures, indicating coupled dissolution–fracturing processes (Figure 3a–b, e–f). (2) Gypsum moldic pores (after gypsum), characterized by relatively regular boundaries that preserve gypsum crystal outlines; these molds are commonly partly filled by analcime, suggesting that analcime cementation occurred after pore formation and locally reduced pore volume
(Figure 3c–d).
Fractures are pervasive at multiple scales and display variable filling degrees(Fang et al. 2020). Some fractures are partly sealed by calcite while still retaining open segments; oil staining or residual oil along fracture-related pores implies that fractures served as effective hydrocarbon migration pathways (Figure 3g). In analcime-rich mixed fine-grained rocks, multi-stage fractures are common and may be filled by analcime and/or organic matter, further highlighting the importance of fracture networks in controlling reservoir effectiveness (Figure 3h–j). At the core scale, dense fracture swarms are widely developed in argillaceous micritic dolostone and laminated fine-grained intervals, supporting the interpretation that fracture-enhanced storage and seepage dominate in the Du-3 reservoirs
(Figure 3k–l).
3.2 Petrophysical Properties
Petrophysical statistics of core and sidewall-core samples from the Du-3 Submember (C7–C9 intervals) indicate that matrix porosity is generally low, whereas permeability spans a wide range (Fig. 4). The average porosity of the dolostone-dominated unit, mud shale, and mixed fine-grained rocks is generally <10%, and most measurements cluster at low porosity values. Among lithologies, sandstones show the highest porosity level and the largest dispersion, whereas analcime-rich rocks, dolostone-dominated rocks, mud shale, and mixed fine-grained rocks are mainly distributed in the low-porosity domain (Figure 4a).
In contrast, permeability exhibits strong variability across multiple orders of magnitude (Figure 4b), and permeability ranges overlap substantially among lithologies. The porosity–permeability crossplot further demonstrates a weak correlation between porosity and permeability (Figure 4c): low-porosity samples may still display relatively high permeability, whereas higher porosity does not necessarily correspond to higher permeability. This mismatch implies that permeability is not primarily controlled by matrix pore volume but is strongly influenced by fracture-related flow pathways. As described above, fractures are well developed in the Du-3 reservoirs and are commonly accompanied by dissolution enlargement along fracture surfaces, which collectively enhance connectivity and dominate seepage capacity. Therefore, reservoir quality of the studied fine-grained rocks is largely governed by the development degree and connectivity of fractures (and associated dissolution pores/vugs), rather than by matrix porosity alone.
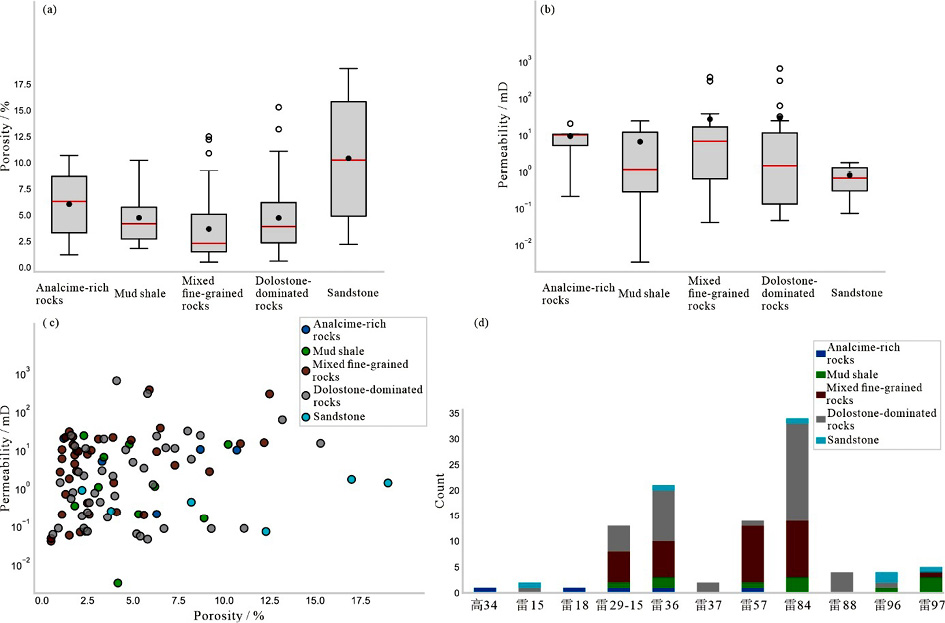
Figure 4 Petrophysical statistics of core samples from the C7–C9 intervals in the Du-3 Submember
Note: (a) boxplots of porosity for different lithologies; (b) boxplots of permeability (log scale); (c) porosity–permeability crossplot; (d) distribution of samples by well and lithology. Lithologies include analcime-rich rocks, mud shale, mixed fine-grained rocks, dolostone-dominated rocks, and sandstone
3.3 Pore-Structure Characteristics
Mercury intrusion capillary pressure (MICP) results indicate that pore–throat sorting is generally poor for all lithologies in the Du-3 Submember, with dispersed pore–throat size distributions and an overall unfavorable pore structure (Figure 5; Table 2)(Kang et al. 2022; Li et al. 2020). Granular carbonate rocks are dominated by intergranular pores and dissolution pores/vugs, and their mercury intrusion curves typically show a coarse-skewed pattern, implying that relatively larger pore throats are more concentrated. Accordingly, these rocks display moderate displacement pressures (0.010–14.861 MPa) and relatively large pore–throat radii (mean radius of 3.098 μm, ranging from 0.032 to 18.983 μm; maximum pore–throat radius 0.049–73.771 μm). They also exhibit comparatively higher mercury withdrawal efficiency, with a mean value of 44.42%, suggesting better pore connectivity relative to other lithologies.
By contrast, dolostone-dominated rocks, mixed fine-grained rocks, and mud shale are characterized by fine-skewed intrusion behavior, indicating that small pore throats dominate the pore system. Their withdrawal curves commonly exhibit an abrupt-drop pattern and pronounced hysteresis (i.e., a large difference between intrusion and extrusion volumes), which reflects a complex pore system with constrained connectivity (e.g., ink-bottle–type pores) and strong heterogeneity. Although the matrix pore system in these lithologies is generally fine, fractures substantially modify the effective pore structure. In particular, dolostone-dominated rocks and mixed fine-grained rocks are mechanically hard and relatively brittle, making them prone to tectonic fracturing; fractures may further evolve into dissolution-enlarged fractures. Mud shale, in turn, commonly develops bedding-parallel (lamination-related) fractures. The development of these fractures can increase the effective pore–throat radius and maximum pore–throat radius, and may also raise the maximum mercury saturation in some samples, thereby improving storage and seepage performance.
Overall, the Du-3 reservoirs are characterized by small pore throats, poor sorting, and an unfavorable pore structure, and the formation of effective reservoirs relies strongly on the development and connectivity of micropores and microfractures.
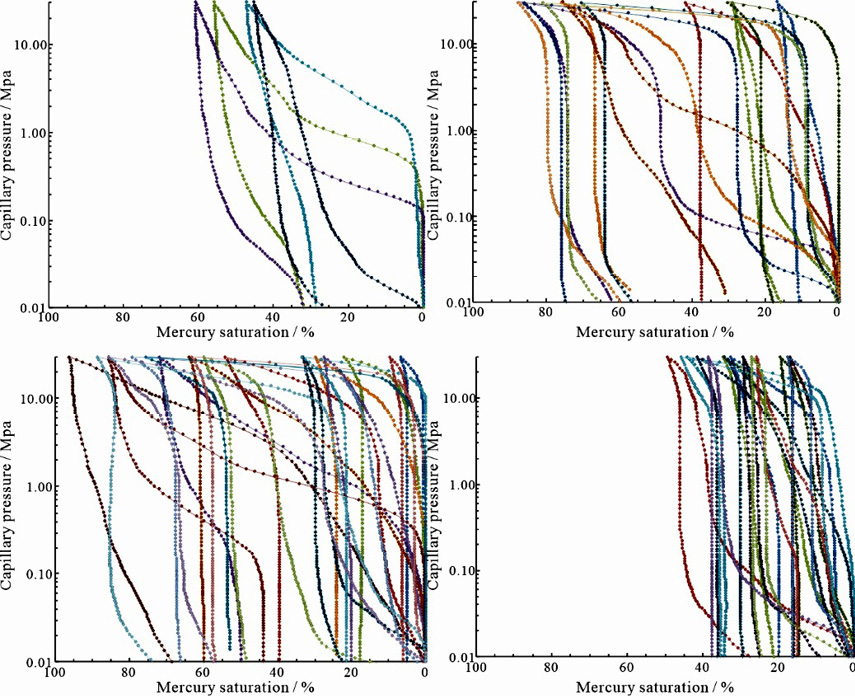
Figure 5 Mercury intrusion capillary pressure (MICP) curves of different rock types from the Du-3 Submember
Note: (a) granular carbonate rocks; (b) mud shale; (c) dolostone-dominated rocks; (d) mixed fine-grained rocks (analcime-bearing)
表
|
MICP Parameter |
Dolostone-Dominated Rocks |
Mud Shale |
Mixed Fine-Grained Rocks |
Granular Carbonate Rocks |
|
Displacement Pressure (MPa) |
3.037 (0.008–20.064) |
2.100 (0.009–19.940) |
2.150 (0.003–20.010) |
2.952 (0.010–14.861) |
|
Mean Pore–Throat Radius (μm) |
5.557 (0.025–30.770) |
4.252 (0.025–22.297) |
12.672 (0.025–49.350) |
3.098 (0.032–18.983) |
|
Coefficient of Variation |
1.303 (0.162–5.300) |
1.636 (0.189–3.517) |
1.243 (0.207–3.067) |
0.736 (0.195–1.151) |
|
Maximum Mercury Saturation (%) |
52.840 (2.40–96.06) |
68.265 (3.69–87.32) |
36.531 (3.570–87.610) |
46.290 (12.96–66.310) |
|
Maximum Pore–Throat Radius (μm) |
32.377 (0.037–92.053) |
29.645 (0.037–85.723) |
62.282 (0.037–224.238) |
11.649 (0.049–73.771) |
|
Homogeneity Coefficient |
0.267 (0.031–0.790) |
0.204 (0.018–0.789) |
0.272 (0.062–0.792) |
0.360 (0.251–0.638) |
|
Mercury Withdrawal Efficiency (%) |
37.77 (5.63–218.11) |
40.558 (13.28–163.90) |
32.049 (3.39–163.94) |
44.42 (32.66–55.89) |
|
Kurtosis |
6.381 (1.751–26.062) |
7.789 (2.068–22.521) |
4.699 (1.842–14.190) |
3.194 (1.932–5.160) |
|
Sorting Coefficient |
7.644 (0.004–35.345) |
6.197 (0.005–23.161) |
14.932 (0.005–44.986) |
3.426 (0.006–21.842) |
4 Reservoir Evaluation and Favorable-zone Prediction
With the continuous advancement of oilfield exploration and development, establishing reservoir classifications and evaluation schemes that are consistent with geological reality has become increasingly important(Jiang et al. 2021; Mao 2020). Accordingly, reservoir evaluation has attracted broad attention, and evaluation approaches have progressively evolved from traditional qualitative assessment to quantitative assessment, and from single-parameter porosity–permeability evaluation to multi-factor evaluation. In most cases, reservoir development is controlled by the combined effects of multiple factors. Therefore, reservoir assessment should avoid relying on a single factor.
When multiple controlling factors are considered simultaneously, conventional practice often overlays a series of factor maps to produce a composite evaluation map. Although such maps can incorporate diverse information, they are commonly associated with strong subjectivity and may introduce bias. To reduce this limitation, this study applies an overlapping probability evaluation method to evaluate and predict reservoir development in the Du-3 Submember(Jiang et al. 2022).
In this method, the major controlling factors for reservoir development are treated as a set of events. Because these factors are not always independent, their relative importance should be represented by weights. Each factor map is first normalized, then multiplied by its weight, and finally summed to generate a probability map of reservoir development. Areas with higher probability indicate more favorable reservoir development, and vice versa (Figure 6).
The probability of reservoir development can be expressed as (taking three controlling factors as an example):
Eq. (1): P = Σ(wi × Fi)
where P is the reservoir-development probability, Fi is the normalized value of the i-th factor, and wi is the corresponding weight (commonly constrained by Σwi = 1).
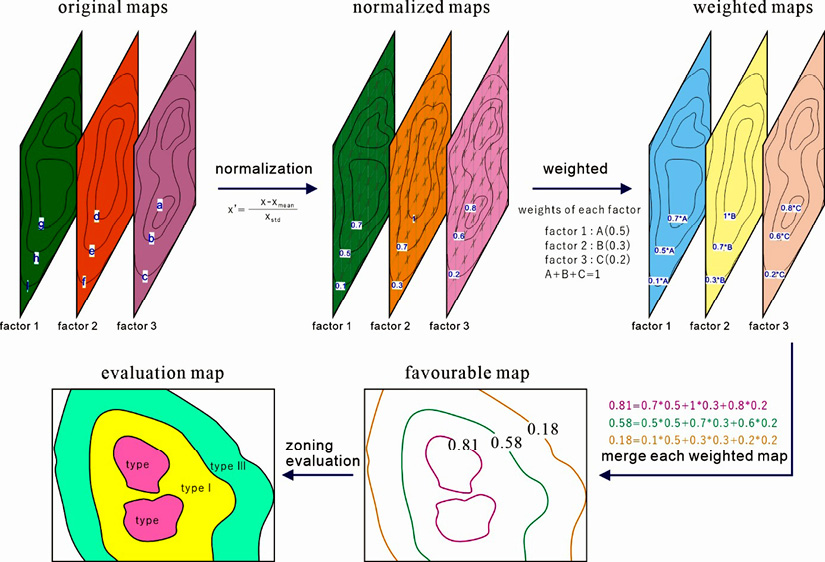
Figure 6 Workflow of the overlapping probability method (illustrated using three factors): normalization of factor maps, weighting of each factor, merging weighted maps to obtain a probability (favorability) map, and zoning-based evaluation
4.1 Hybrid Weight Determination
A variety of weighting approaches can be used to determine the relative importance of factors controlling reservoir development, such as grey relational analysis, factor analysis, discriminant analysis, expert scoring, and the Relief F algorithm. In this study, a hybrid weighting method combining the Analytic Hierarchy Process (AHP) and the entropy-weight method is adopted to determine the weights of different controlling factors. AHP provides a structured framework for weighting but may involve notable subjectivity during hierarchical judgments, whereas the entropy method yields comparatively objective weights by quantifying the information content of the data. The hybrid approach integrates the strengths of both methods and is thus suitable for the present reservoir evaluation.
The hybrid weight ωj is calculated as:
Eq. (2): ωj = (ωj1 + ωj2) / m
where ωj1 is the weight obtained by AHP, ωj2 is the weight obtained by the entropy-weight method, and m is the number of factors (indices) involved in the evaluation.
4.2 Reservoir Evaluation and Favorable-Zone Prediction
Prior to reservoir evaluation and prediction for the Du-3 Submember of Member 4 of the Shahejie Formation in the Leijia area, Western Sag, it is necessary to identify quantifiable factors that control reservoir development. Based on previous studies and the geological characteristics of the study interval, six controlling factors were selected: brittleness index, carbonate thickness, fracture density, average porosity, average permeability, and total organic carbon (TOC)(Han 2019; Liu 2019). Spatial distribution maps of these factors were generated by kriging interpolation to obtain gridded factor maps for subsequent integration.
To determine factor weights, a hybrid weighting scheme combining the Analytic Hierarchy Process (AHP) and the entropy-weight method was applied. In AHP, a pairwise comparison matrix was constructed based on expert scoring (Table 3). Together with the entropy-derived weights, the hybrid weights were then calculated using Eq. (2). The resulting comprehensive weights for brittleness index, carbonate thickness, fracture density, average permeability, average porosity, and TOC are 0.0887, 0.4569, 0.0773, 0.2945, 0.0350, and 0.0477, respectively (Table 4). The reservoir-development probability was subsequently computed using Eq. (1).
表
|
Influencing Factor |
Brittleness Index |
Carbonate Thickness |
Fracture Density |
Average Permeability |
Average Porosity |
TOC |
|
Brittleness Index |
1 |
1/2 |
2 |
2 |
5 |
1/2 |
|
Carbonate Thickness |
2 |
1 |
5 |
2 |
4 |
5 |
|
Fracture Density |
1/2 |
1/5 |
1 |
3 |
2 |
2 |
|
Average Permeability |
1/2 |
1/2 |
1/3 |
1 |
3 |
2 |
|
Average Porosity |
1/5 |
1/4 |
1/2 |
1/3 |
1 |
2 |
|
TOC |
2 |
1/5 |
1/2 |
1/2 |
1/2 |
1 |
表
|
Method |
Brittleness Index |
Carbonate Thickness |
Fracture Density |
Average Permeability |
Average Porosity |
TOC |
|
AHP |
0.1897 |
0.3603 |
0.1479 |
0.1245 |
0.0743 |
0.1032 |
|
Entropy Weight Method |
0.0841 |
0.2282 |
0.0940 |
0.4257 |
0.0848 |
0.0832 |
|
Comprehensive Weight |
0.0887 |
0.4569 |
0.0773 |
0.2945 |
0.0350 |
0.0477 |
After obtaining the reservoir-development probability map, the optimal number of reservoir classes was initially unknown. Therefore, both the elbow method and the silhouette method were employed to estimate the appropriate number of classes(Jin et al. 2017; Luan et al. 2022). The results indicate that dividing the reservoir into four types is most suitable (Figure 7a–b). Using the class labels derived from K-means clustering, the classification intervals were further determined. The boxplot of probability values shows that class means can serve as objective cutoffs; accordingly, the reservoir probability ranges were defined as [0, 0.0587), [0.0587, 0.1898), [0.1898, 0.3987), and [0.3987, +∞) (Figure 7c), corresponding to Types IV, III, II, and I, respectively (from low to high favorability).
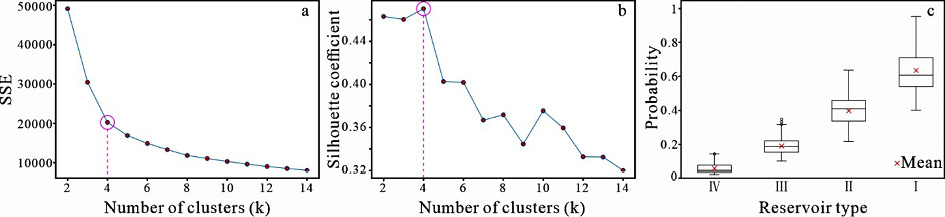
Figure 7 Determination of reservoir types and classification intervals based on the K-means method
Note: (a) elbow method; (b) silhouette coefficient; (c) boxplots of reservoir-development probability for different reservoir types (I–IV).
Based on the selected controlling factors and their hybrid weights, a reservoir-development probability (P) was calculated for each grid cell using Eq. (1), and a probability map was generated for the Du-3 Submember. According to the classification intervals derived from the K-means-based zoning (Figure 7), the study area was divided into four reservoir types, and corresponding evaluation criteria were established for each parameter (Table 5). Specifically, areas with P > 0.3987 were classified as Type I reservoirs, representing the most favorable reservoir belt (i.e., sweet spots) for shale-oil and/or tight-oil exploration(Deng et al. 2020; Mao 2020). Type I reservoirs are mainly distributed along the long axis of the lacustrine basin, forming a continuous belt approximately following the L15–L84–L59–S90–L93 trend(Jiang et al. 2021).
Within the Type I belt, an additional target-oriented subdivision is recognized: north of the Type I boundary line corresponds to the favorable tight-oil exploration zone, whereas south of the boundary line corresponds to the favorable shale-oil exploration zone. The northern tight-oil zone (e.g., L15, L84, L53, L37, and L88) is dominated by argillaceous micritic dolostone, analcime-bearing dolostone, and analcime-rich mixed fine-grained rocks, where reservoir effectiveness is mainly controlled by fracture networks and fracture-related dissolution pore/vug development(Fang et al. 2020; Huang 2016). In contrast, the southern shale-oil zone (e.g., L93, S90, L97, and L99) is dominated by felsic mixed fine-grained rocks, which provide the principal lithological framework for shale-oil accumulation(Guo, Zhao, and Chen 2021; Lin et al. 2021).
Production-test results provide independent validation for the Type I delineation. Wells L15, L84, L53, L97, L37, S90, L88, and L93 within the Type I belt generally show favorable test performance, with the maximum daily oil production reaching 83.1 t/d in L15 and 27.4 t/d in L88.
Areas with P = 0.1898–0.3987 were classified as Type II reservoirs (relatively favorable zones), which are mainly composed of argillaceous limestone and dolomitic limestone, with dissolution pores as the dominant storage space. Areas with P = 0.0587~0.1898 were classified as Type III reservoirs (less favorable zones), whereas areas with P < 0.0587 were defined as Type IV reservoirs (unfavorable zones).
表
|
Reservoir Type |
Brittleness Index (%) |
Carbonate Thickness (m) |
Fracture Density (fractures/m) |
Average Permeability (mD) |
Average Porosity (%) |
TOC (%) |
|
Type I |
≥ 0.4491 |
≥ 40.4458 |
≥ 1.8897 |
≥ 46.8076 |
≥ 8.2761 |
≥ 4.6758 |
|
Type II |
0.2658~0.4491 |
29.1477~40.4458 |
1.8897~2.5221 |
2.0439~46.8076 |
5.7751~8.2761 |
4.3360~4.6758 |
|
Type III |
0.0563~0.2658 |
1.6914~29.1477 |
0.6618~2.5221 |
0.9742~2.0439 |
2.2004~5.7751 |
2.5268~4.3360 |
|
Type IV |
< 0.0563 |
< 1.6914 |
< 0.6618 |
< 0.9742 |
< 2.2004 |
< 2.5268 |
5 Conclusions
Based on K-means clustering of 303 quantitative whole-rock XRD datasets from the Du-3 Submember, three lithological groups were identified: carbonate rocks, felsic mixed fine-grained rocks, and analcime-rich mixed fine-grained rocks. This data-driven classification provides a quantitative basis for subsequent reservoir characterization and evaluation.
Reservoir space in the Du-3 Submember is dominated by dissolution pores/vugs and fractures. Porosity of all three lithological groups is generally low and mainly concentrated within 0%~10%. Despite the low matrix porosity, carbonate rocks and analcime-rich mixed fine-grained rocks exhibit relatively higher mean permeabilities (43.43 mD and 43.71 mD, respectively), which is consistent with the key role of fracture networks and fracture-related dissolution enhancement. MICP results further indicate small pore–throat radii, poor sorting, low homogeneity, and an overall unfavorable pore structure, implying that effective reservoir development largely depends on the connectivity provided by micropores and microfractures rather than matrix pores alone.
Using six quantifiable controlling factors—brittleness index, carbonate thickness, fracture density, average porosity, average permeability, and TOC—the Du-3 reservoir was divided into four reservoir types by K-means clustering. These factors were then integrated through the overlapping probability evaluation method to delineate favorable zones. The predicted Type I sweet-spot belt is mainly distributed along the long axis of the lacustrine basin, approximately following the L15–L84–L59–S90–L93 trend, providing a practical geological basis for targeting tight-oil and shale-oil exploration in the study area.